
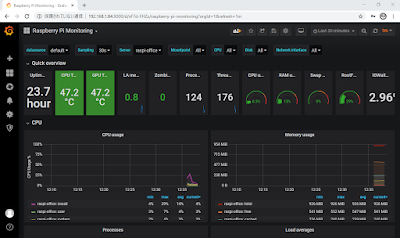
Grafana Labs でラズパイ用の Grafana ダッシュボード Raspberry Pi Monitoring が公開されているので試してみました。
CPU 使用率やメモリ使用率等だけでなく、CPU や GPU の温度も確認できるようです。
Raspbian の標準リポジトリから Grafana をインストールするとログイン画面が真っ白で何も表示されなかったので、Grafana サイトのリポジトリからインストールしました。
なお、Raspberry Pi Monitoring はデータソースに InfluxDB、メトリックスコレクタに Telegraf を使うことが前提のようなのでこれらもインストールしました。
環境
- Raspberry Pi 3 Model B
- Raspbian GNU/Linux 10 (buster)
Ansible インストール
Ansible の playBook で Grafana, InfluxDB, Telegraf をインストールしてみるので、まずは Ansible をインストールしました。
$ sudo apt install ansible
Ansible playbook ファイル作成
pbook-grafana.yaml を作成
- hosts: localhost
  vars:
    distrib_id: debian
    distrib_codename: buster
  connection: local
  gather_facts: no
  become: true
  handlers:
    - name: telegraf-restarted
      service:
        name: telegraf
        state: restarted
  tasks:
    # influxdb, telegraf 共通
    - name: influxdb, telegraf apt_key
      apt_key:
        url: https://repos.influxdata.com/influxdb.key
        state: present
    - name: influxdb, telegraf apt_repository
      apt_repository:
        repo: deb https://repos.influxdata.com/{{ distrib_id }} {{ distrib_codename }} stable
        state: present
        filename: influxdb
    - name: influxdb, telegraf apt update
      apt:
        update_cache: yes

    # influxdb
    - name: apt install influxdb
      apt:
        update_cache: no
        state: present
        pkg:
          - influxdb
    - name: service influxdb start
      service:
        name: influxdb
        state: started

    # telegraf
    - name: apt install telegraf
      apt:
        update_cache: no
        state: present
        pkg:
          - telegraf
    - name: service telegraf start
      service:
        name: telegraf
        state: started
    - name: telegraf user
      user:
        # GPU 温度取得 (vcgencmd measure_temp) のために必要
        name: telegraf
        groups: video
    - name: telegraf blockinfile
      blockinfile:
        dest: /etc/telegraf/telegraf.d/raspi.conf
        create: yes
        block: |
          [[inputs.net]]

          [[inputs.netstat]]

          [[inputs.file]]
            files = ["/sys/class/thermal/thermal_zone0/temp"]
            name_override = "cpu_temperature"
            data_format = "value"
            data_type = "integer"

          [[inputs.exec]]
            commands = ["/opt/vc/bin/vcgencmd measure_temp"]
            name_override = "gpu_temperature"
            data_format = "grok"
            grok_patterns = ["%{NUMBER:value:float}"]
      notify:
        telegraf-restarted

    # grafana
    - name: grafana apt_key
      apt_key:
        url: https://packages.grafana.com/gpg.key
        state: present
    - name: grafana apt_repository
      apt_repository:
        repo: deb https://packages.grafana.com/oss/deb stable main
        state: present
        filename: grafana
    - name: grafana apt update
      apt:
        update_cache: yes
    - name: apt install grafana
      apt:
        update_cache: no
        state: present
        pkg:
          - grafana
    - name: service grafana-server start
      service:
        name: grafana-server
        state: started
    - name: grafana systemd
      systemd:
        name: grafana-server.service
        state: started
        enabled: yes
Ansible でインストール
$ ansible-playbook -i localhost, pbook-grafana.yaml
インストール後の InfluxDB データベース確認
InfluxDB shell 起動
$ influx
Connected to http://localhost:8086 version 1.8.0
InfluxDB shell version: 1.8.0
>
データベース確認
> show databases
name: databases
name
----
_internal
telegraf
- telegraf データベースが作成されていました。
telegraf データベースを選択
> use telegraf
Using database telegraf
telegraf データベースの measurements を確認
> show measurements
name: measurements
name
----
cpu
cpu_temperature
disk
diskio
gpu_temperature
kernel
mem
net
netstat
processes
swap
system
試しに gpu_temperature のデータを確認
> select * from gpu_temperature limit 3;
name: gpu_temperature
time                host  value
----                ----  -----
1587525501000000000 raspi 50.5
1587525510000000000 raspi 49.9
1587525520000000000 raspi 50.5
- 取得した GPU の温度が格納されているようです。
InfluxDB shell 終了
> quit
ブラウザでアクセスできるようになるまで待つ
ansible を実行すると grafana-server の起動まで完了しますが、初めて起動する時はしばらく (5分程度) は 3000番ポートが開かれていないためブラウザでアクセスできません
3000番ポートが開かれている場合
$ netstat -na | grep 3000
tcp6       0      0 :::3000                 :::*                    LISTEN
3000番ポートが開かれていない場合
$ netstat -na | grep 3000
$
3000番ポートが開かれていない場合でもログが流れているので起動していることがわかります。
$ sudo tail -f /var/log/grafana/grafana.log
3000番ポートが開かれるのを待って次に進みます。
ブラウザで Grafana にログイン
- URL: http://[grafana-server の IP]:3000/login
- 初期ログイン情報
- ID: admin
- PW: admin
- 案内に従いパスワード変更
データソースに InfluxDB を登録
- [Confuguration (歯車アイコン)] - [Data Sources]
- [Add data source]
- influxDB を選択
- Name: InfluxDB (任意)
- Name の [Default] を ON
- url: http://localhost:8086/
- Access: Server (dfault)
- Whitelisted Cookies: (空)
- Auth は全てデフォルト通り無効
- Database: telegraf
- User, Password, HTTP Method は空白
- Min time interval も空白
- [Save & Test]
Data source is workingと表示された
Raspberry Pi Monitoring ダッシュボートを Import
ダッシュボード ID (今回は 10578) を指定するとインポートできるようですが、今回の環境ではなぜかうまくいかなかったので、サイトから json ファイルをダウンロードしてインポートやってます。
ダッシュボードの JSON ファイル取得
- URL: https://grafana.com/grafana/dashboards/10578
- [Download JSON] から raspberry-pi-monitoring_rev1.json をダウンロード
ダッシュボードを登録
- [Create (+ アイコン)] - [Import]
- [Upload .json file] で上でダウンロードした raspberry-pi-monitoring_rev1.json をアップロード
- 以下入力
- Name: Raspberry Pi Monitoring (多分任意)
- Folder: General
- Unique identifier (uid): value set (初期値)
- influxdb: InfluxDB
- [Import]
ダッシュボードで Raspberry Pi のリソースを見ることができるようになりました。
参考
- https://iot-plus.net/make/raspi/visualizing-watt-environment-using-influxdb-grafana/
- https://docs.influxdata.com/influxdb/v1.7/introduction/installation/
- https://goozenlab.com/blog/2019/08/telegraf-pi-install/
- https://www.magata.net/memo/index.php?InfluxDB����#o28fc611
- https://grafana.com/docs/grafana/latest/installation/debian/#install-on-debian-or-ubuntu
- https://grafana.com/docs/grafana/latest/features/datasources/influxdb/
- https://grafana.com/grafana/dashboards/10578
- https://grafana.com/grafana/dashboards/928